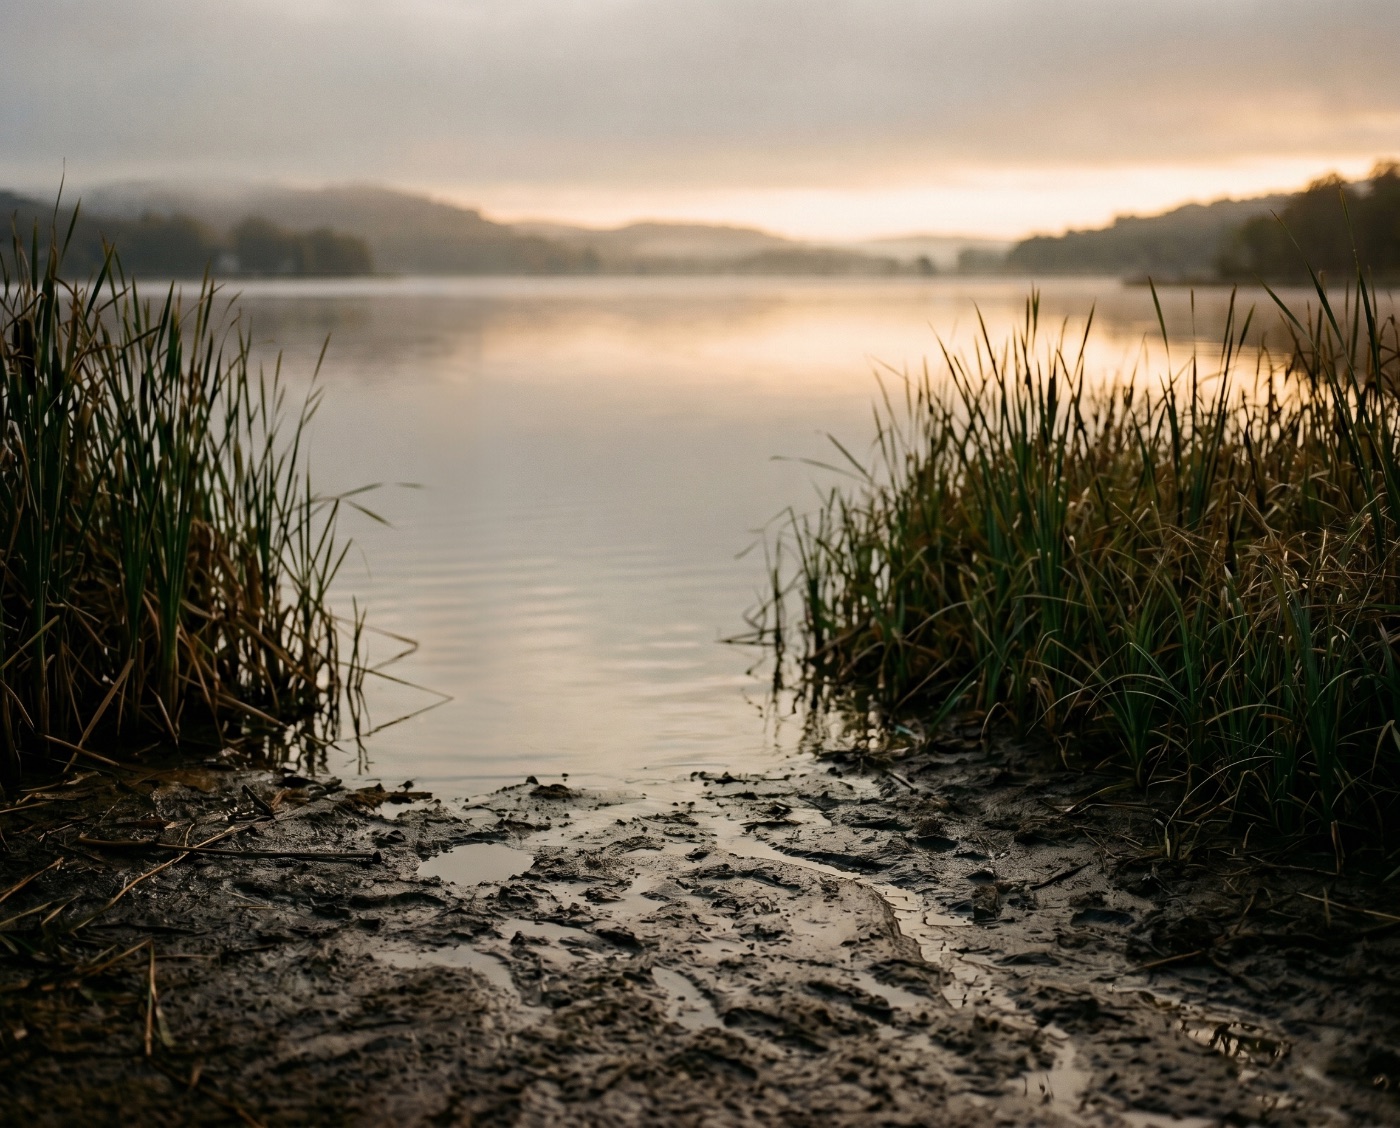
Reviving Victoria.
An Earth-observation-guided restoration plan for the Lake Victoria South Basin, Kenya — integrating two decades of satellite, climate and geodetic data into a single, spatially-prioritised recovery strategy.
Three decades of fragmented evidence
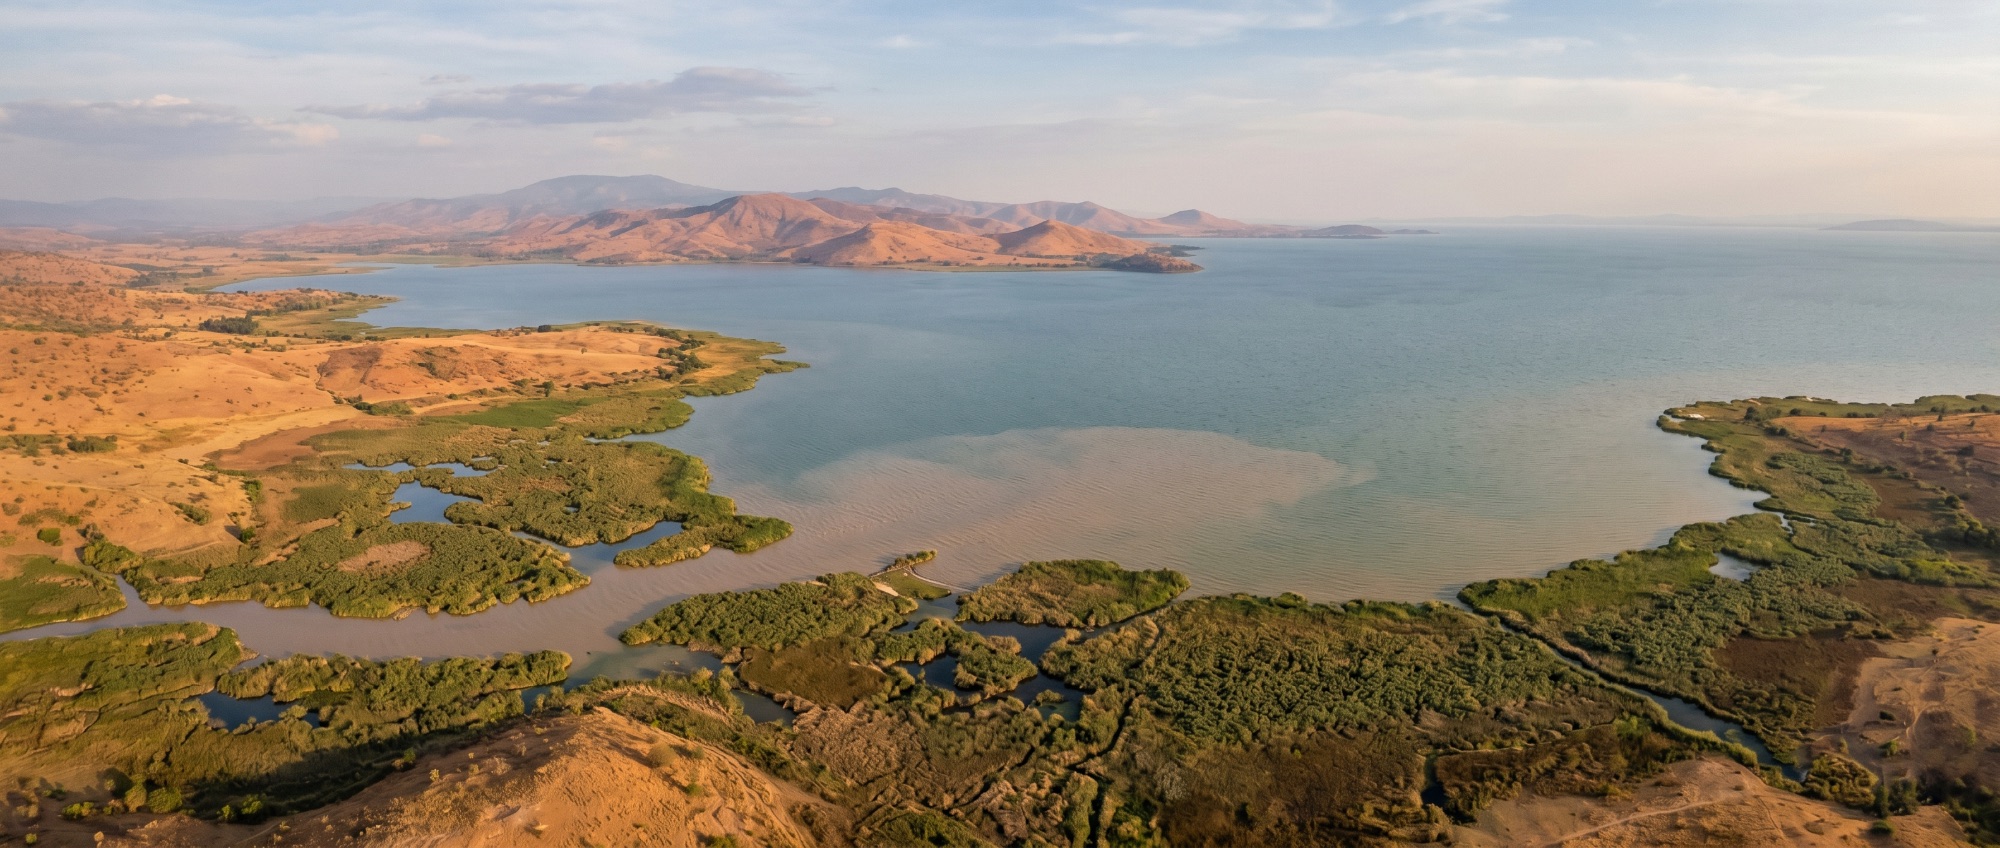
Lake Victoria is the largest freshwater lake in Africa and a lifeline for millions across Kenya, Uganda and Tanzania. Yet its South Basin has suffered three decades of rapid degradation — deforestation, agricultural and settlement encroachment, artisanal mining, and climate-driven shifts in rainfall.
Earlier studies each captured a single facet — land cover, water quality, or lake level — across different periods and scales. None had synthesised these signals into one basin-wide picture that decision-makers could act on. That gap is what this work set out to close.
No single dataset explains the decline. The recovery plan had to read land, water and climate as one connected system.
A multimodal Earth-observation framework
GWO integrated four independent satellite and reanalysis records into a single analytical framework, processed in Google Earth Engine and QGIS — each chosen to constrain a different driver of change, with uncertainty stated throughout.
- Sentinel-2 SR 2017–2025
- Surface-water quality indices — chlorophyll-a (NDCI) and turbidity.
- Landsat 7/8/9 2005–2025
- Random-Forest land-use / land-cover across five epochs.
- MODIS Terra LST 2000–2024
- Land-surface thermal response.
- ERA5-Land 2000–2023
- Near-surface (2 m) air-temperature trend.
- Copernicus altimetry 1992–2024
- Basin-mean lake water-surface height.
What the basin told us
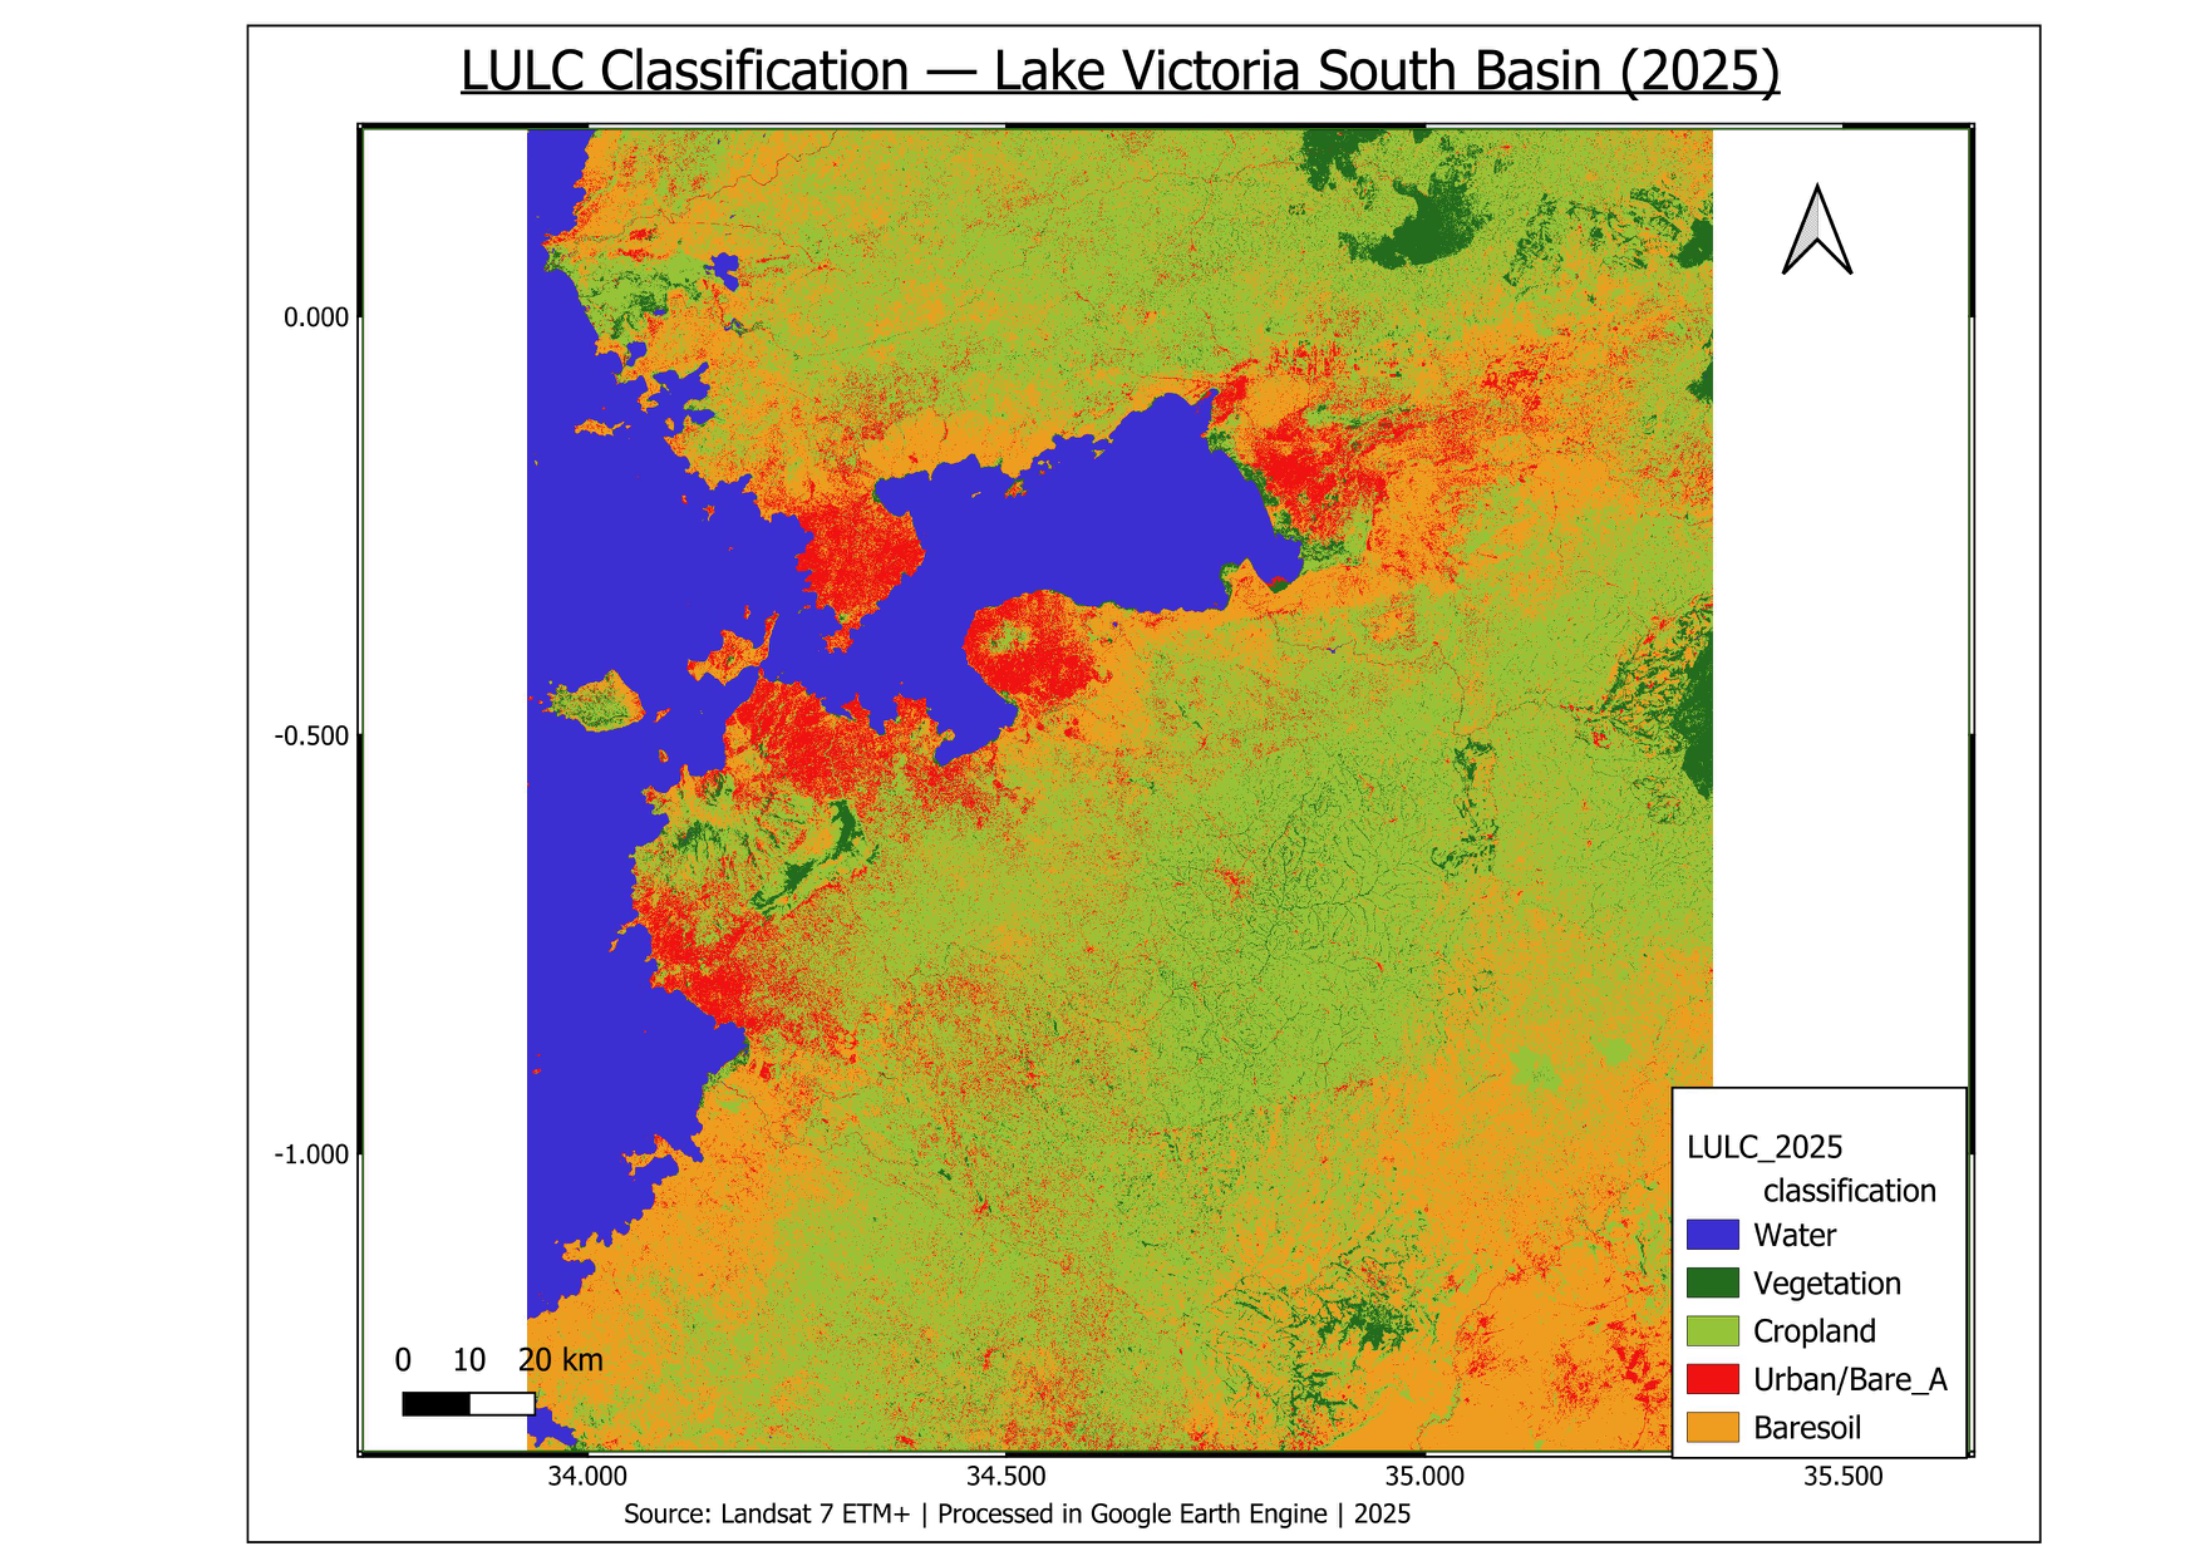
A Random Forest classifier (200 trees, 70/30 split) reached 96.7% overall accuracy (κ = 0.957) and was applied uniformly across all five epochs. The 2005–2025 land-cover transitions are stark:
Water quality & a shifting climate
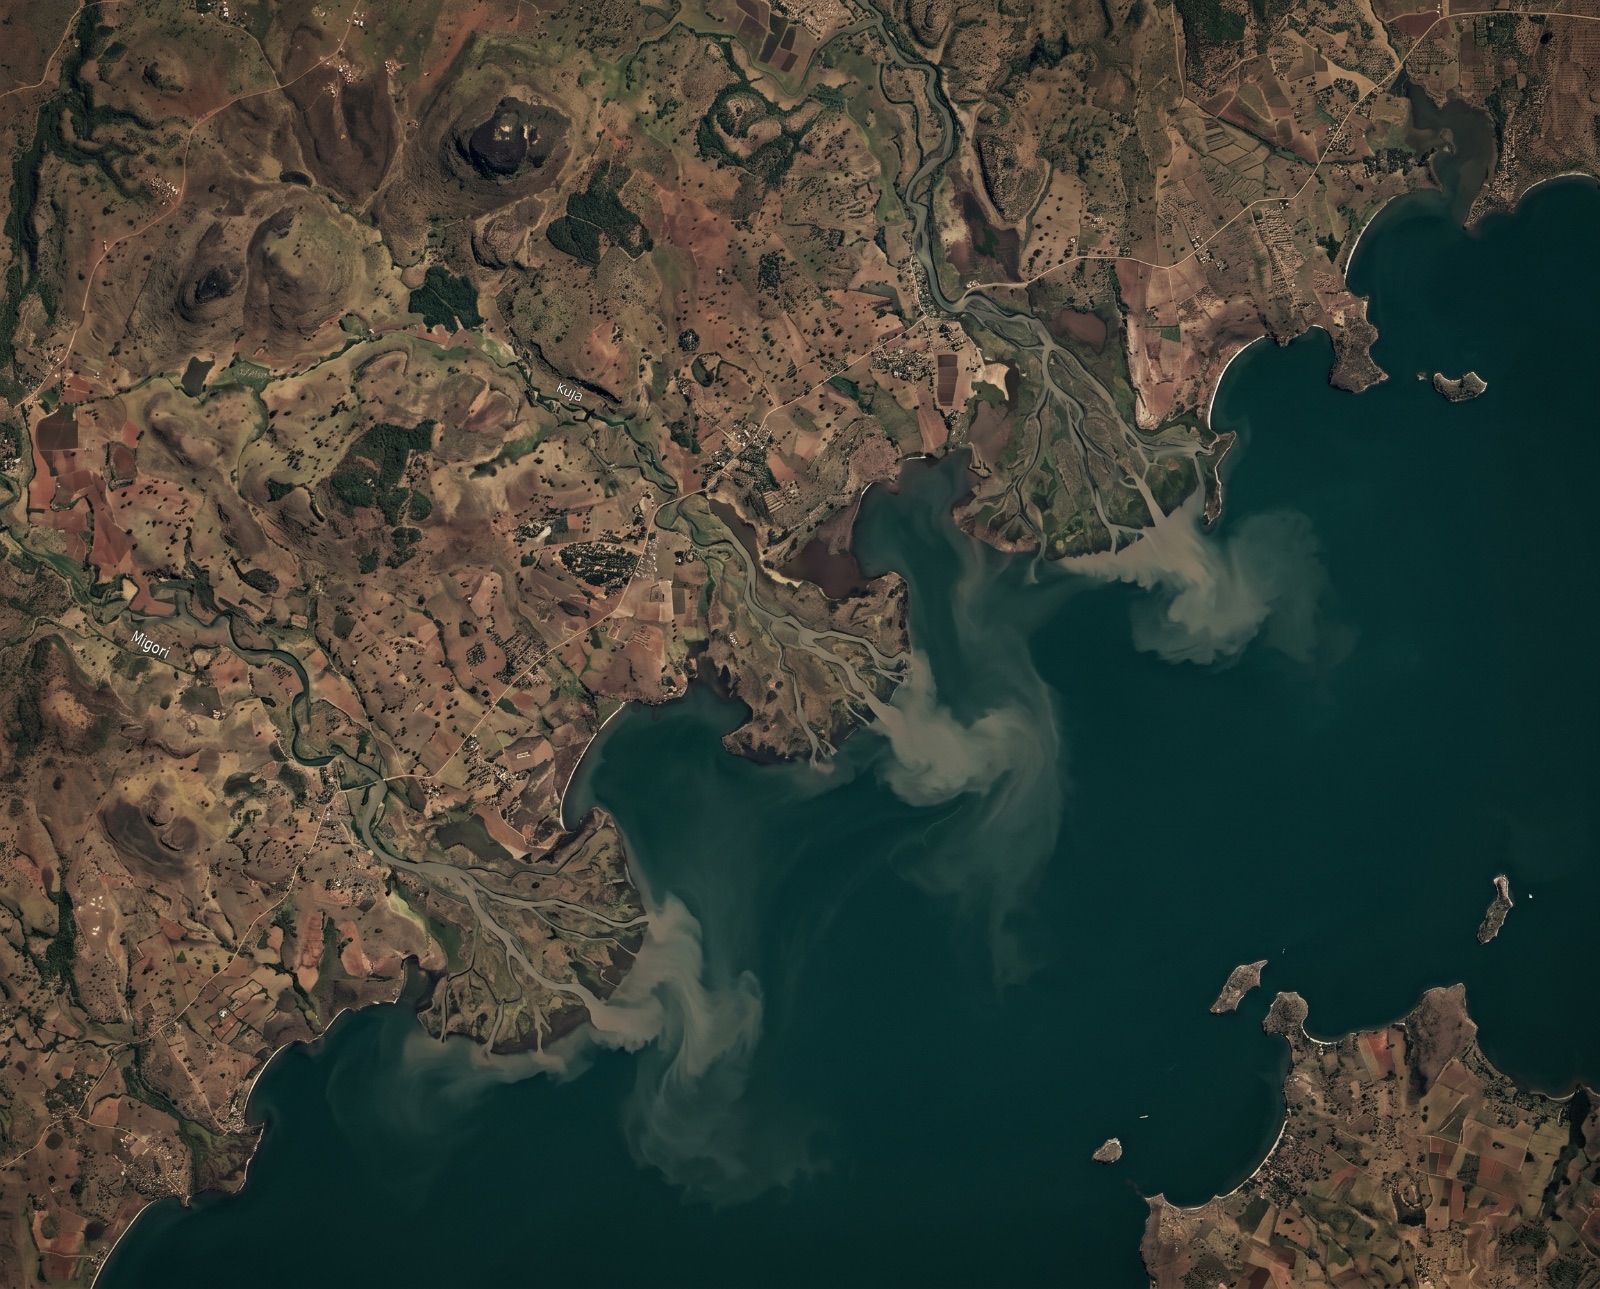
Satellite water-quality indices document persistent eutrophication in the Winam Gulf: the chlorophyll-a proxy (NDCI) rose steadily and peaked in 2023, while falling turbidity signalled a shift from sediment-dominated to algae-dominated waters — a hallmark of advancing eutrophication.
ERA5-Land shows atmospheric warming of 0.17 °C decade⁻¹, while the post-2019 lake-level anomaly has persisted alongside elevated flood frequency — evidence of compounding hydro-climatic stress rather than a single gradual trend.
Low-cost monitoring with GNSS reflectometry
To make ongoing monitoring affordable, GWO carried a coastal GNSS reflectometry (GNSS-IR) feasibility study inland to Lake Victoria. Each candidate station is a single ground-based receiver that reads the lake surface from satellite signals reflected off the water — across all four constellations: GPS, Galileo, GLONASS and BeiDou. We propagated the constellations, counted the usable low-elevation reflection arcs over open water at seven candidate shore sites, and modelled the height precision of each.
The inland setting turns out to be better suited than the open ocean in one decisive respect. A lake has no tide, so a day's arcs can be averaged directly into a daily mean rather than spent fitting a tidal curve — and with hundreds of arcs per day, the daily-mean lake level is driven down to the station's systematic floor of ~0.5 cm at every site. It is floor-limited, not sampling-limited.
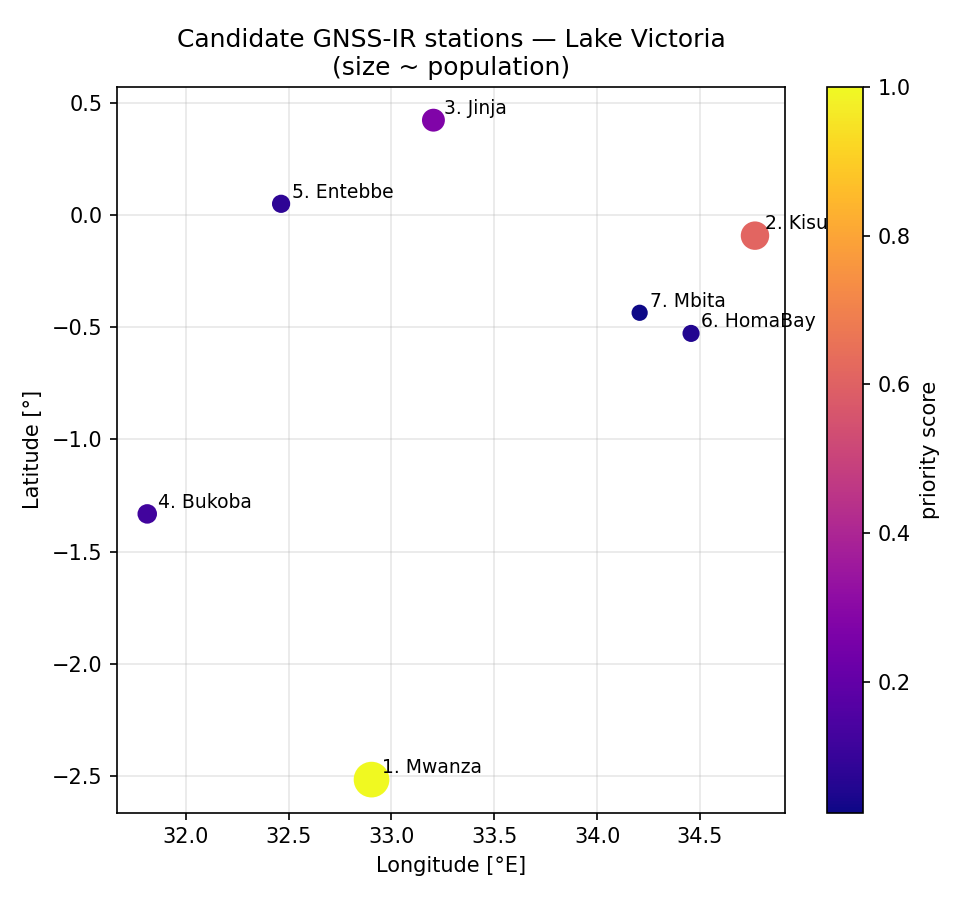
The top three sites form a natural trans-boundary network across the lake's three states: Mwanza (Tanzania's main lake port), Kisumu (the Kenyan lake city hit by the 2020 floods) and Jinja (Uganda's Nile-outflow and hydropower control point, where lake level is operationally critical). Gulf and bay sites see a narrower open-water sector and so fewer arcs; open-shore sites the most.
| # | Site | Country | Meas / day | Daily-mean σ |
|---|---|---|---|---|
| 01 | Mwanza | Tanzania | 224 | 0.5 cm |
| 02 | Kisumu | Kenya | 229 | 0.5 cm |
| 03 | Jinja | Uganda | 255 | 0.5 cm |
| 04 | Bukoba | Tanzania | 289 | 0.5 cm |
| 05 | Entebbe | Uganda | 328 | 0.5 cm |
| 06 | Homa Bay | Kenya | 222 | 0.5 cm |
| 07 | Mbita | Kenya | 291 | 0.5 cm |
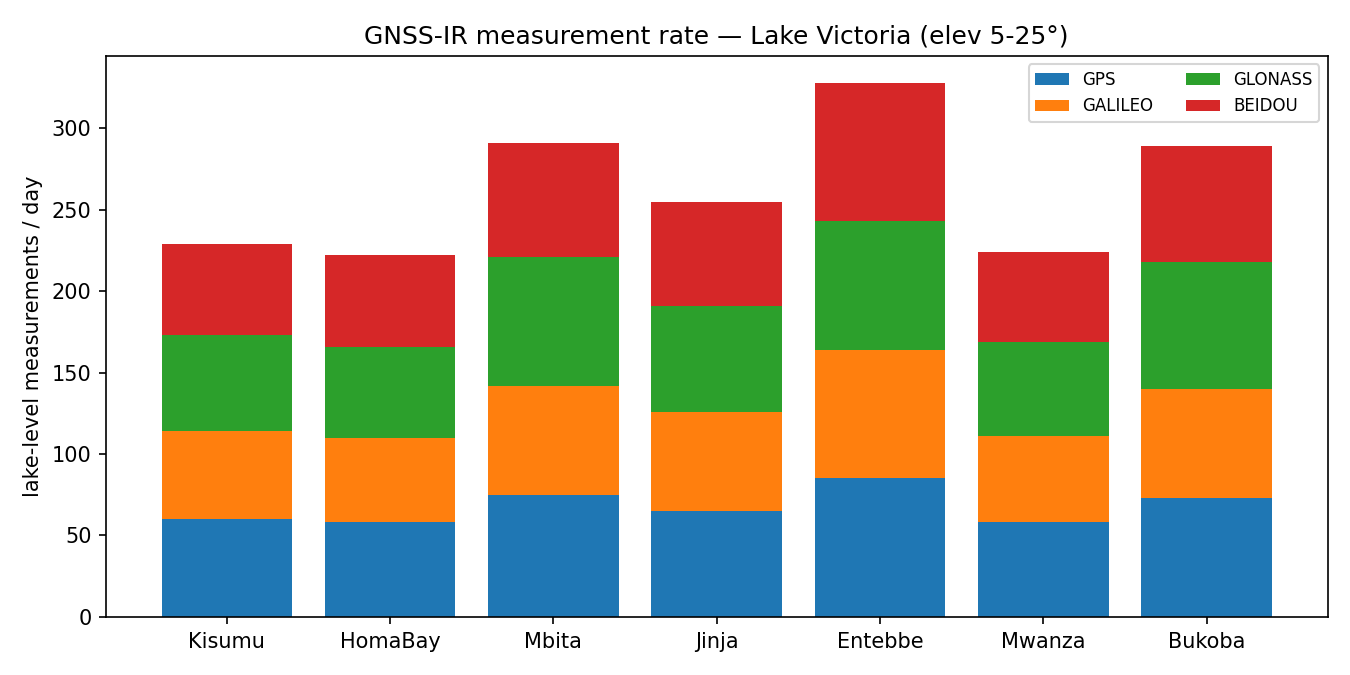
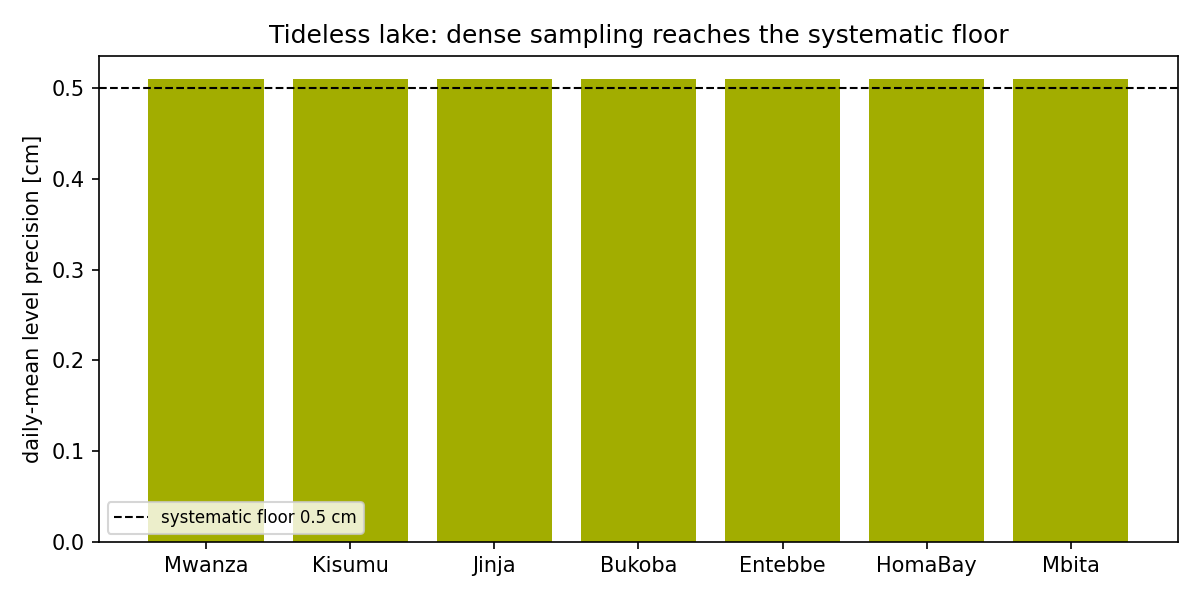
On a tideless lake, the constellations give you far more observations than you need. The limit is no longer the sky — it is the station's own systematics.
Relative to existing monitoring, the value is threefold: each riparian state gets its own high-rate, common-datum lake-level series where shared gauge data has been intermittent; a continuous record at Jinja supports hydropower-release decisions tied to lake level; and the near-shore, high-cadence point measurements complement — and can validate — the coarse sampling of satellite radar altimetry. The main siting caveat is Lake Victoria's papyrus-fringed shore: stations must target genuinely open water — ports, jetties and rocky points — confirmed by a local shoreline and horizon survey.
The recommendation: prioritise, don’t generalise
The signals converge on one conclusion — restoration should be spatially targeted, not uniformly applied. GWO’s central recommendation is a Restoration Priority Index: a single composite layer combining vegetation-loss magnitude, water-quality deterioration and flood exposure.
- 01
Targeted afforestation
Direct replanting to the sub-catchments with the steepest measured forest loss.
- 02
Near-shore pollution mitigation
Concentrate nutrient and sediment controls on the Winam Gulf hotspots flagged by NDCI.
- 03
Habitat-linked fisheries management
Tie fisheries policy to measured habitat availability and water-quality recovery.
- 04
Deploy & validate GNSS-R
Stand up a low-cost three-station network \u2014 Mwanza, Kisumu, Jinja \u2014 for sub-daily, common-datum monitoring across all three riparian states.
The framework is designed to extend across the trans-boundary basin in partnership with Uganda and Tanzania — turning a one-off assessment into a living monitoring system.
Sources & data
This case study is a condensed summary of independent research. For full data sources, datasets and references, please get in touch.
Facing a similar land or water question?
If you need a baseline you can defend and a strategy decision-makers can adopt, tell us about the site and the question in front of you.